A Guide for RNAscope™ Data Analysis - a Wealth of Gene Expression Information from
Tissue Context
On This Page
Single-plex Target Expression Scenarios
- Homogeneous target expression in a particular cell type
- Heterogeneous target expression in a particular cell type
- Target expression in ≥2 different cell types
- Subpopulation or region-specific target expression
- Subcellular localization of target expression
- Qualitative assessment for presence or absence of a target
RNAscope Technology
The RNAscope assay provides a powerful method to detect gene expression within the spatial and morphological context of the tissue. The proprietary “double Z” probe design in combination with advanced signal amplification techniques enables highly specific and sensitive detection of target RNA, which can be visualized as a dot, with each dot representing a single RNA transcript. This robust, high signal-to-noise technology allows for the detection of gene transcripts at the single molecule level with single-cell resolution and can further expand our understanding of gene expression in cell lines and tissues samples. The multiplexing capabilities of both the chromogenic and fluorescent RNAscope assays facilitate the simultaneous visualization of multiple targets. Here, we provide data analysis guidelines for several types of RNAscope staining results, including semi-quantitative and quantitative analysis methods for each of the various gene expression scenarios.
Homogeneous Target Expression in a Particular Cell Type
Scenario Description
In the homogeneous target expression scenario cells display relatively uniform staining for the target RNA, indicating homogeneous gene expression among the same cell type (Figure 1). The overall homogeneous target expression level of the entire cell population throughout a tissue section can be assessed by measuring the average number of dots per cell.

Figure 1. Homogeneous expression of MICA (A) and MICB (B) in human ovarian cancer tissue using the RNAscope 2.5 HD BROWN assay.
Analysis Guidelines
The average number of dots per cell can be measured by using either a semi-quantitative histological scoring methodology (called methodology #1) based on our scoring criteria or image-based quantitative software analysis tools (called methodology #2). According to methodology #1 guidelines, MICA and MICB expression are scored as 1 and 2, respectively.
To read the rest of this chapter, Download the PDF.
Heterogeneous Target Expression in a Particular Cell Type
Scenario Description
In the heterogeneous target expression scenario cells display different levels of staining for the target RNA, indicating heterogeneous gene expression among the same cell type (Figures 3 and 4). In this scenario both the expression level and the percent of cells expressing the target at different levels could be of importance.
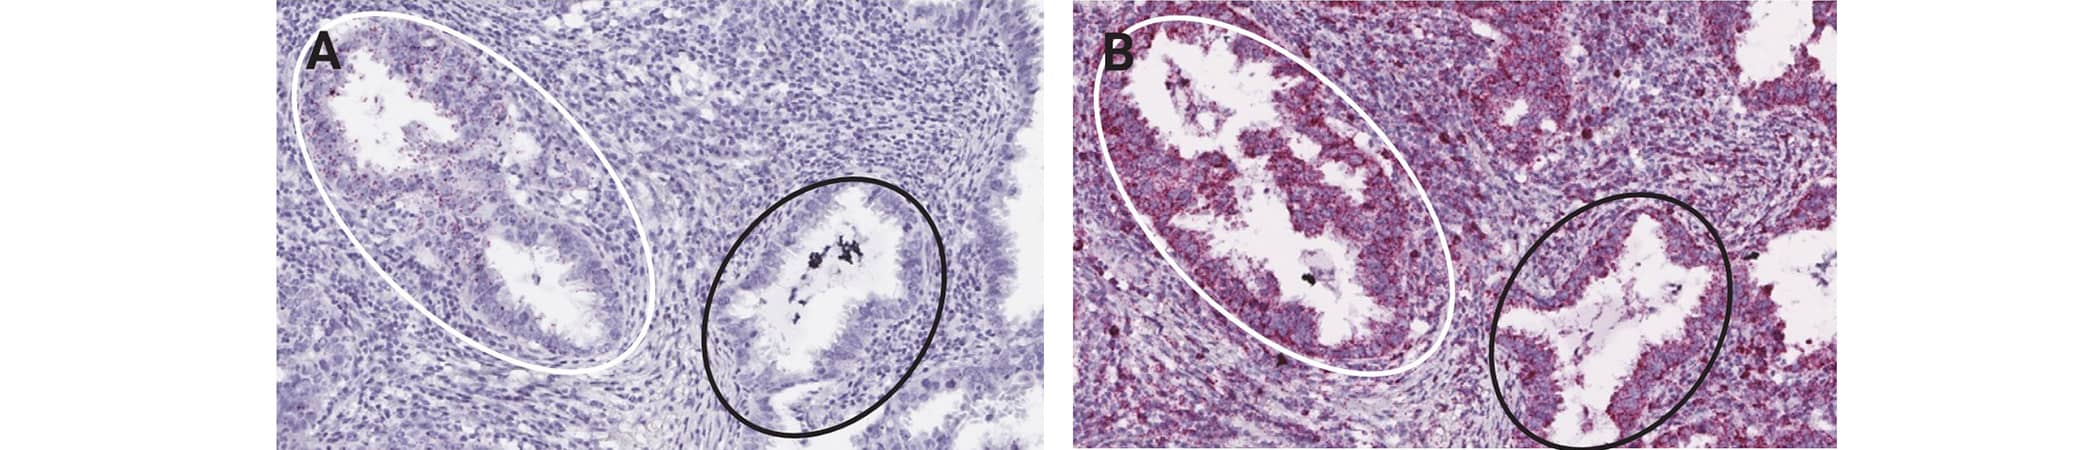
Figure 3. Heterogeneous expression for AFAP1-AS1 (A) and positive control staining (B) in human lung cancer tissue using the RNAscope 2.5 HD RED assay. Shown are two foci, one that expresses AFAP1-AS1 (white circle) and one that does not express AFAP1-AS1 (black circle)(A). This demonstrates heterogeneous AFAP1-AS1 expression between two tumor foci and suggests the presence of two clonal tumor populations. The expression of the PPIB housekeeping gene is uniform between the tumor cells of each foci, indicating good quality RNA expression in both foci (B).

Figure 4. Heterogeneous expression of PD-L1 in green showing high, medium and low expression in human lung cancer tissue using the RNAscope 2.5 HD Duplex assay. CTLA4 is shown in red.
Analysis Guidelines
The expression level and the percent of cells expressing the target at different levels can be analyzed in the following ways:
- Assess the overall expression level of the entire sample (average number of dots per cell) using methodology #1 or methodology #2.
The dynamic range of expression (cell-by-cell expression profiles) can be quantified for the entire tissue section or selected regions of interest by binning cells with different levels of expression into separate bins as shown in Figure 5. The data can be presented as a histogram to represent the expression level distribution or can be calculated as a Histo score (H score). This H score can be achieved by semi-quantitative analysis or quantitative imagebased software analysis where the percentage of cells within each bin characterized by a certain expression level or number of dots (ACD scores ranging from 0 to 4) is estimated and the overall H score (range of 0 to 400) is calculated as follows:
H-score = Σ (ACD score or bin number x percentage of cells per bin) Bin 0 -> 4
Scenario Description
In this scenario the target of interest is expressed in two or more distinct cell types (Figure 6). In this scenario both the expression level and the percent of cells expressing the target at different levels could be of importance.
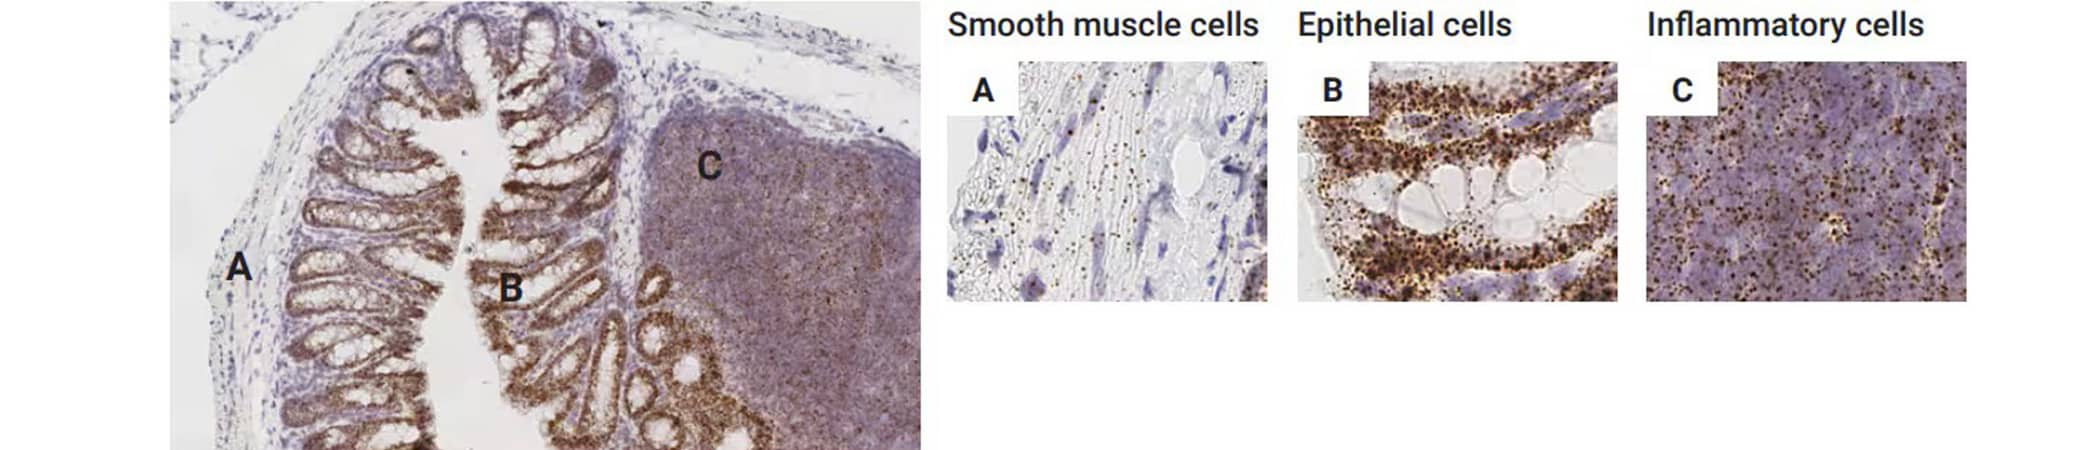
Figure 6. Detection of Ctnnb1 (β-catenin) expression in mouse colon with TNBS-induced colitis. Here we can observe Ctnnb1 expression in smooth muscle cells (muscularis propria) (A), colonic epithelial cells (B), and inflammatory cells (lymphoid aggregate) (C).
Analysis Guidelines
In the scenario that a biomarker or target is expressed in two or more different cell types, the two cell types can be analyzed independently according to methodologies #1 and #2. H score (methodology #3) can also be derived, but it is recommended to use software analysis. The analyses can also be combined to calculate the percentage positive for each cell type of interest.
Scenario Description
In this scenario the target of interest is specifically expressed in a (sub)population of cells or a particular region (Figures 8 and 9). In this scenario both the expression level and the percent of cells expressing the target at different levels could be of importance.

Figure 7. Region-specific expression pattern for Lgr5 in mouse colon using the RNAscope 2.5 HD BROWN assay.
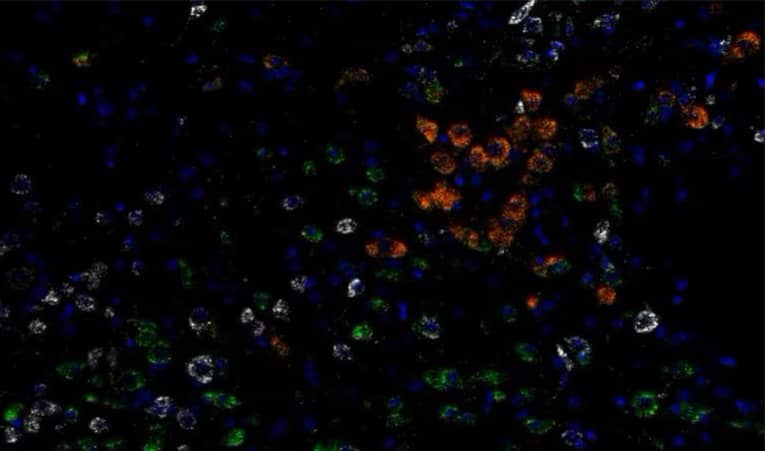
Figure 8. Subpopulation-specific expression for Vglut1 (red) and Vglut2 (green) on glutamatergic neuronal populations and Vgat (white) on GABAergic neurons in normal mouse brain using the RNAscope™ LS Multiplex Fluorescent Assay. Cells are counterstained with DAPI (blue).
Analysis Guidelines
In the scenario that a biomarker or target is expressed in a specific (sub)population of cells or a specific region, one can specifically analyze this relevant cell (sub)population or region according to methodologies #1 and #2. H score (methodology #3) can also be derived, but it is recommended to use software analysis. Furthermore, percentage positive cells can be assessed based on number of cells with ≥1 dot/cell.
Scenario Description
In this scenario RNA can be expressed in a particular subcellular compartment, eg. nuclei or cytoplasm, and the expression level within that particular subcellular compartment could be of importance (Figures 9 and 10).
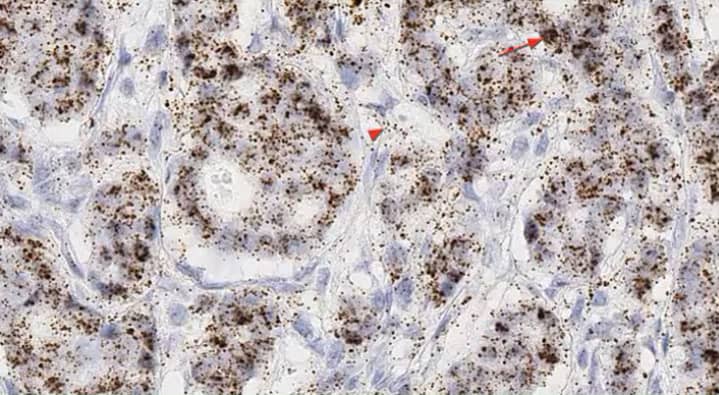
Figure 9. Subcellular expression of GAS5 in breast cancer using the RNAscope 2.5 HD BROWN assay. GAS5 is detected in both the nucleus (arrow) and cytoplasm (arrow head)
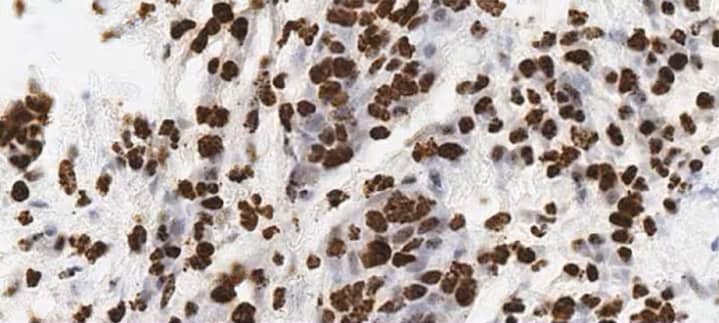
Figure 10. Subcellular expression of MALAT1 in lung cancer using the RNAscope 2.5 HD BROWN assay. MALAT1 is detected primarily in the nucleus.
Analysis Guidelines
In the scenario that a biomarker or target is expressed in a specific subcellular compartment data analysis can be challenging due to 2D representation (the image) of a 3 dimensional structure (the tissue). However, a qualitative analysis of the relative expression within each compartment could be informative and methodologies #1 and #2 can be applied for quantification. Furthermore, percentage positive cells can be assessed based on number of cells with ≥1 dot/cell.
Scenario Description
For certain disease assessments, a qualitative analysis with simply a positive or negative for the presence of a marker could be more important than quantifying the expression of the marker (Figure 11).

Figure 11. Detection of HPV infection in human samples using the RNAscope 2.5 HD BROWN assay. The probe HPV-HR18 detects 18 high risk subtypes of the HPV E6/E7 gene. The condyloma tissue sample is negative for high risk HPV, whereas the head and neck tumor sample is positive for high risk HPV.
Analysis Guidelines
Within the cell population of interest, the assessment of marker expression needs to be reviewed in conjunction with the positive and negative control slides. If the positive and negative control slides have stained appropriately, and depending on the threshold previously set to determine positivity for that particular marker, the cells of interest could be called positive or negative for the marker.
Expression of 2 Independent Targets in Different Cell Types
Scenario Description
For this scenario the assay simultaneously detects the expression pattern of two genes of interest. In this scenario both the expression level and the percent of cells expressing each of the targets could be of importance and therefore can be analyzed according to the single-plex scenarios applicable for each of the targets (Figures 12 and 13).

Figure 12. Drd1 (red) and Drd2 (green) expression on distinct medium spiny neuronal cell populations in the striatum of normal mouse brain using the RNAscope™ Multiplex Fluorescent Assay. Cells are counterstained with DAPI (blue).
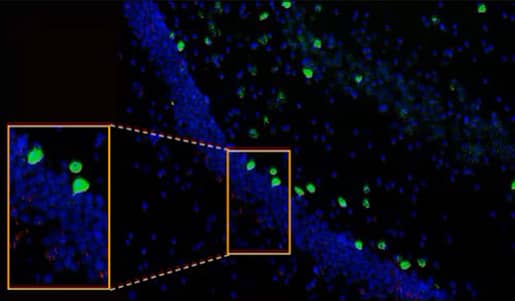
Figure 13. Cnr1 (green) and Drd1 (red) expression in the hippocampus of normal mouse brain using the RNAscope™ Multiplex Fluorescent Assay. Cells are counterstained with DAPI (blue).
Analysis Guidelines
To determine the target expression for each of the genes within a particular cell type, one can qualitatively and quantitatively assess the expression pattern by using methodologies #1, #2 and #3. These methodologies can be combined to create percentage of cells positive. Cells can be scored visually at 40x based on number of cells with >1 dot/cell across the entire tissue section. Percent dual positive can be calculated in two ways.
Target Co-expression in a Particular Cell Type
Scenario Description
In this scenario cells co-express two genes simultaneously, enabling identification of the target of interest along with the cell type that expresses that target of interest or the co-expression of two particular targets (Figures 15, 16).
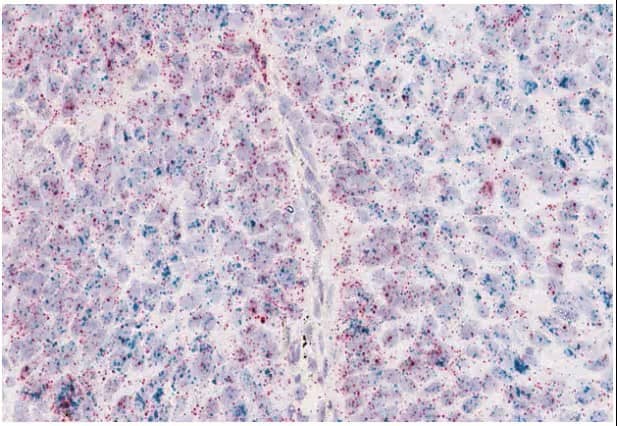
Figure 15. Co-expression of PD-L1 (green) and TGFβ1 (red) in lung tumor cells using the RNAscope™ 2.5 HD Duplex assay.
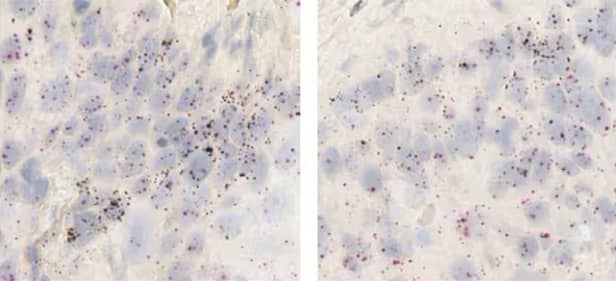
Figure 16. Co-expression of the NRG1 ligand (brown) and the ERBB3 receptor tyrosine kinase (red) in esophageal tumor cells using the RNAscope 2.5 LS Duplex assay.
Analysis Guidelines
To determine the target co-expression, the degree of simultaneous co-expression of the target with the cell type marker or both targets of interest can be assessed qualitatively or image-based quantitative software analysis can be carried out to obtain this information. In this respect, methodologies #1, #2 and #3 can be applied. To determine co-expression across markers and positivity in specific cell populations, these methodologies can be combined to calculate percentage of positive cells. Cells can be scored visually at 40x based on number of cells with >1 dot/cell across the entire tissue section. Percent dual positive is defined as number of cells positive for both Target 1 and Target 2 / total number of cells.
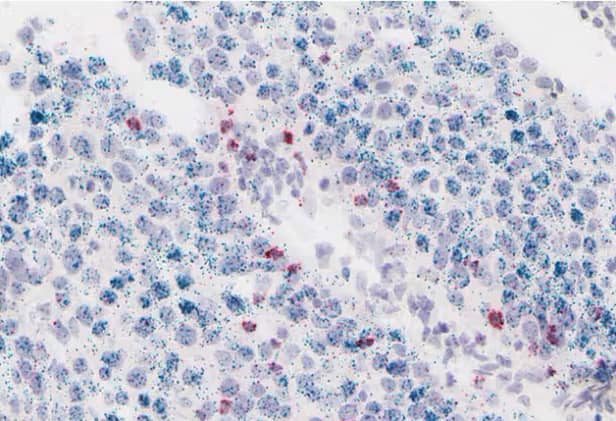
Figure 19. CD8-positive T cells (red) infiltrating a PD-L1-positive (green) tumor region in lung cancer using the RNAscope™ 2.5 HD Duplex assay.
Analysis Guidelines
To determine the rare cell expression, one can qualitatively and quantitatively assess the expression pattern by using methodologies #1 and #2.
Cell Population Interactions
Scenario Description
In this scenario specific cell type populations and their spatial relationship to one another are being investigated (Figure 20). The number of cells expressing the targets of interest can be assessed and their proximity to one another within the tissue environment.

Figure 20. The spatial relationship of CD45-positive cells (red) with PD-L1-positive (green) tumor cells in lung cancer using the RNAscope™ 2.5 HD Duplex assay.
Analysis Guidelines
Assessment of the expression pattern can be qualitative or quantitative using methodologies #1 and #2.
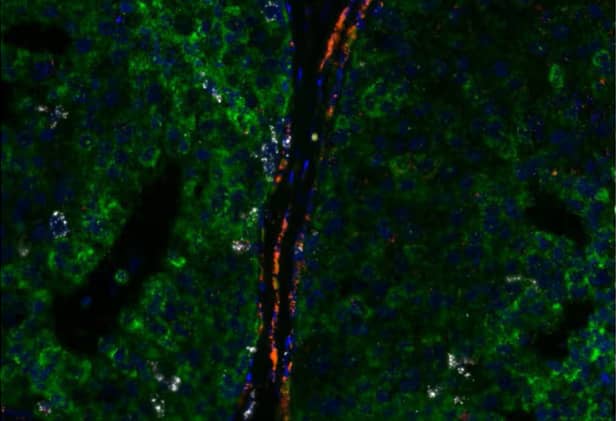
Figure 21. Multiplex expression of KRT19 (green), PECAM1 (red) and MKI67 (white) in human breast cancer using the RNAscope™ 2.5 LS Multiplex Fluorescent Assay. Cells are counterstained with DAPI (blue).

Figure 22. Multiplex expression pattern for Vglut1 (red), Vglut2 (green) and Vgat (white) in mouse brain using the RNAscope™ 2.5 LS Multiplex Fluorescent Assay. Cells are counterstained with DAPI (blue).
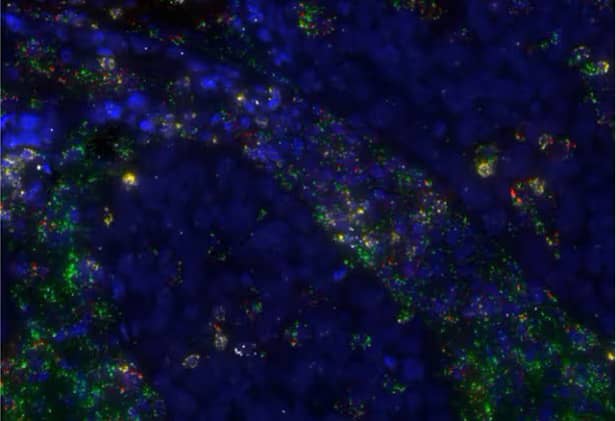
Figure 23. Multiplex expression of TGFβ1 (green), CD8A (yellow), CD4 (red) and TNFα (white) in human lung cancer using the RNAscope™ 2.5 LS Multiplex Fluorescent Assay. Cells are counterstained with DAPI (blue).
Analysis Guidelines
One can qualitatively and quantitatively assess the expression pattern by using methodologies #1, #2 and #3. For further guidelines on how to quantify RNAscope fluorescent assay results see the protocol Guidelines on how to quantify RNAscope™ Fluorescent Assay Results.
To understand co-localization across markers and positivity in specific cell populations, percentage of cells positive can be scored visually at 40x based on number of cells with ≥1 dot/cell.