
Human M-CSF R/CD115 Antibody
R&D Systems, part of Bio-Techne | Catalog # AF329

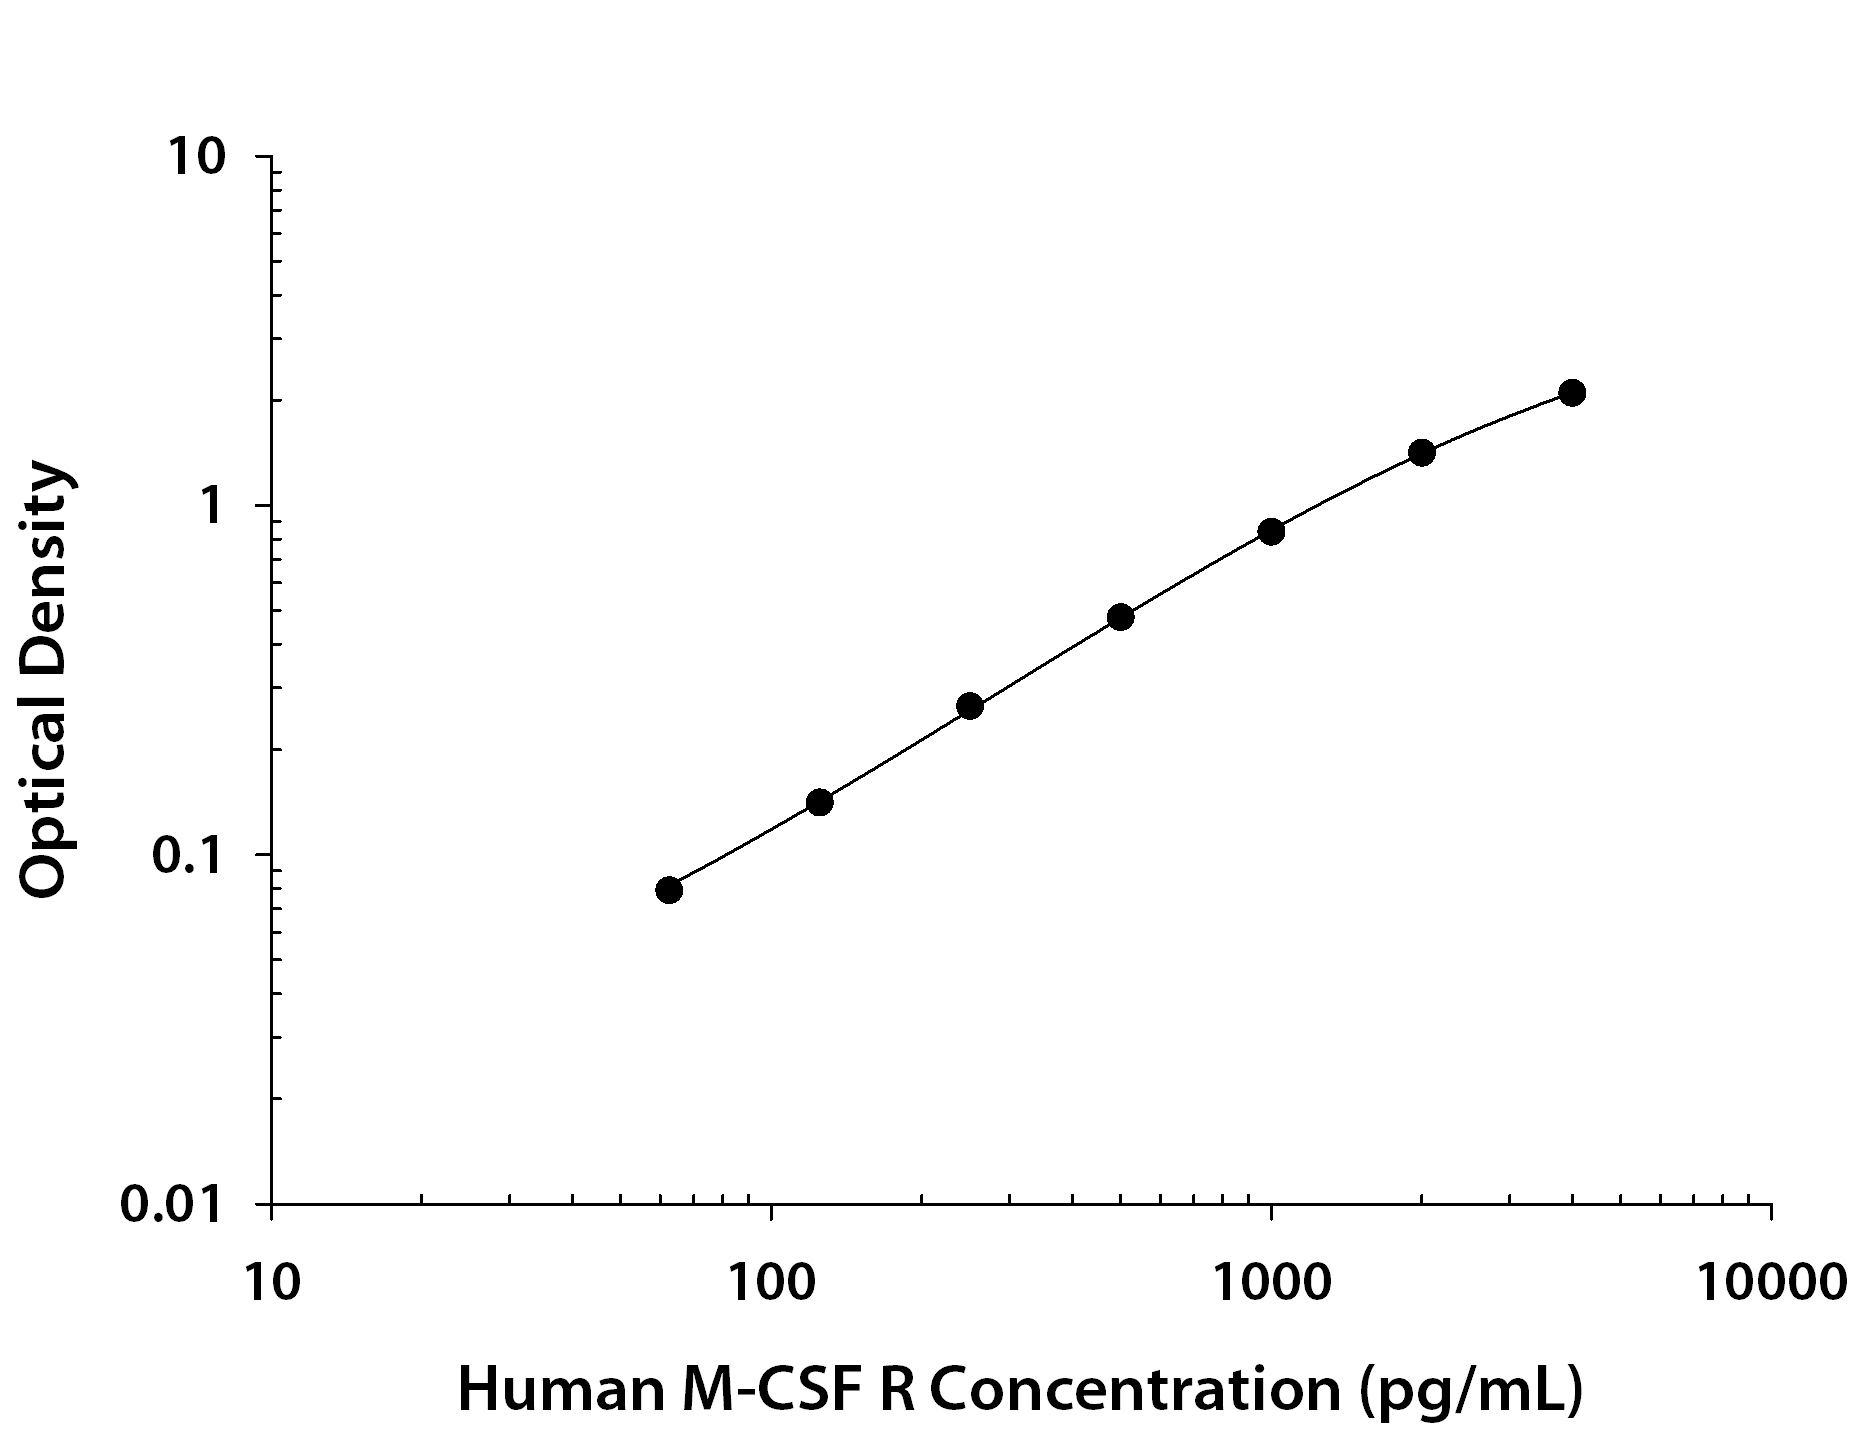
Scientific images may be resized, cropped, or adjusted for brightness or contrast for presentation purposes. These updates are limited to presentation and do not affect the underlying scientific interpretation of the data. Where available, additional source data may be provided upon request.
Conjugate
Catalog #
Key Product Details
Species Reactivity
Validated:
Human
Cited:
Human
Applications
Validated:
Western Blot, Flow Cytometry, CyTOF-ready
Cited:
Immunohistochemistry-Paraffin
Label
Unconjugated
Antibody Source
Polyclonal Goat IgG
Product Specifications
Immunogen
Mouse myeloma cell line NS0-derived recombinant human M-CSF R/CD115
Ile20-Glu512
Accession # CAA27300
Ile20-Glu512
Accession # CAA27300
Specificity
Detects human M-CSF R/CD115 in direct ELISAs and Western blots.
Clonality
Polyclonal
Host
Goat
Isotype
IgG
Scientific Data Images for Human M-CSF R/CD115 Antibody
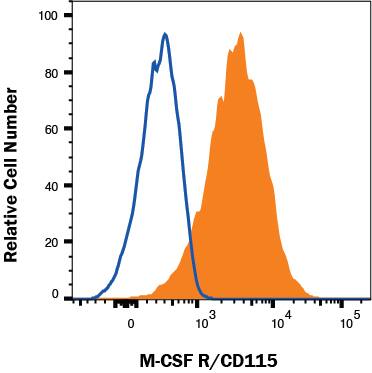
Detection of M-CSF R/CD115 in THP-1 cells by Flow Cytometry
THP-1 cells were stained with Goat Anti-Human M-CSF R/CD115 Antigen Affinity-purified Polyclonal Antibody (Catalog # AF329, filled histogram) or isotype control antibody (Catalog # AB-108-C, open histogram) followed by Allophycocyanin-conjugated Anti-Goat IgG Secondary Antibody (Catalog # F0108). View our protocol for Staining Membrane-associated Proteins.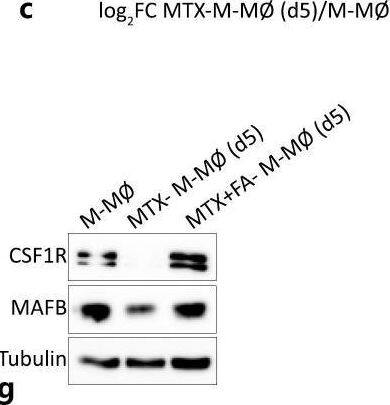
Detection of M-CSF R/CD115 by Western Blot
MTX modulates the expression of MAF, MAFB, and CSF1R in M-MØ. a Schematic representation of the experiment. Monocytes were differentiated to macrophages in the presence of M-CSF for 7 days. Five micromolar MTX was added once on monocytes [MTX-M-MØ], or on 2 days (MTX-M-MØ [d2]) or 5 days (MTX-M-MØ [d5]) after the beginning of the differentiation process with M-CSF. RNA or protein levels were determined at day 7. b Relative mRNA expression levels of the indicated genes as determined by qRT-PCR on M-MØ, MTX-M-MØ, MTX-M-MØ (d2), and MTX-M-MØ (d5). Mean ± SEM of three independent donors are shown. Groups were compared by applying one-way ANOVA (with Tukey's post hoc test, *p < 0.05). c Scatter plot of RNAseq results showing upregulated expression gene changes in MTX-M-MØ versus MTX-M-MØ (d5). d Venn diagram comparing the genes differentially expressed by MTX in MTX-M-MØ with the genes significantly altered by MTX in and MTX-M-MØ (d5). e Allogeneic CD3+ T-lymphocyte proliferation promoted by M-MØ and MTX-M-MØ (d5). Shown are two experiments using independent preparations of M-MØ. Mean ± SEM of six replicates performed in each experiment are shown (**p < 0.01). f Immunoblot analysis of CSF1R, MAFB, and MAF by M-MØ and MTX-M-MØ (d5). GAPDH protein levels were determined as protein loading control. g Immunoblot analysis of CSF1R and MAFB by M-MØ, MTX-M-MØ (d5), or MTX-M-MØ (d5) exposed to FA. Tubulin protein levels were determined as protein loading control. Image collected and cropped by CiteAb from the following open publication (https://pubmed.ncbi.nlm.nih.gov/36380627), licensed under a CC-BY license. Not internally tested by R&D Systems.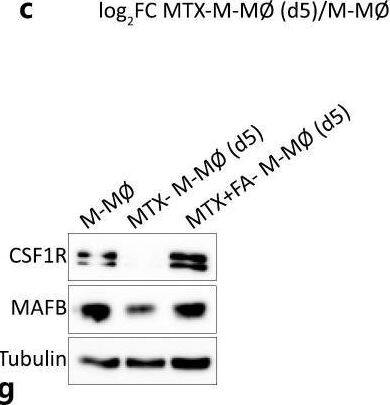
Detection of M-CSF R/CD115 by Western Blot
MTX modulates the expression of MAF, MAFB, and CSF1R in M-MØ. a Schematic representation of the experiment. Monocytes were differentiated to macrophages in the presence of M-CSF for 7 days. Five micromolar MTX was added once on monocytes [MTX-M-MØ], or on 2 days (MTX-M-MØ [d2]) or 5 days (MTX-M-MØ [d5]) after the beginning of the differentiation process with M-CSF. RNA or protein levels were determined at day 7. b Relative mRNA expression levels of the indicated genes as determined by qRT-PCR on M-MØ, MTX-M-MØ, MTX-M-MØ (d2), and MTX-M-MØ (d5). Mean ± SEM of three independent donors are shown. Groups were compared by applying one-way ANOVA (with Tukey's post hoc test, *p < 0.05). c Scatter plot of RNAseq results showing upregulated expression gene changes in MTX-M-MØ versus MTX-M-MØ (d5). d Venn diagram comparing the genes differentially expressed by MTX in MTX-M-MØ with the genes significantly altered by MTX in and MTX-M-MØ (d5). e Allogeneic CD3+ T-lymphocyte proliferation promoted by M-MØ and MTX-M-MØ (d5). Shown are two experiments using independent preparations of M-MØ. Mean ± SEM of six replicates performed in each experiment are shown (**p < 0.01). f Immunoblot analysis of CSF1R, MAFB, and MAF by M-MØ and MTX-M-MØ (d5). GAPDH protein levels were determined as protein loading control. g Immunoblot analysis of CSF1R and MAFB by M-MØ, MTX-M-MØ (d5), or MTX-M-MØ (d5) exposed to FA. Tubulin protein levels were determined as protein loading control. Image collected and cropped by CiteAb from the following open publication (https://pubmed.ncbi.nlm.nih.gov/36380627), licensed under a CC-BY license. Not internally tested by R&D Systems.Applications for Human M-CSF R/CD115 Antibody
Application
Recommended Usage
CyTOF-ready
Ready to be labeled using established conjugation methods. No BSA or other carrier proteins that could interfere with conjugation.
Flow Cytometry
0.25 µg/106 cells
Sample: THP-1 human acute monocytic leukemia cell line
Sample: THP-1 human acute monocytic leukemia cell line
Western Blot
0.1 µg/mL
Sample: Recombinant Human M-CSF R/CD115 Fc Chimera (Catalog # 329-MR)
Sample: Recombinant Human M-CSF R/CD115 Fc Chimera (Catalog # 329-MR)
Formulation, Preparation, and Storage
Purification
Antigen Affinity-purified
Reconstitution
Reconstitute at 0.2 mg/mL in sterile PBS. For liquid material, refer to CoA for concentration.
Formulation
Lyophilized from a 0.2 μm filtered solution in PBS with Trehalose. See Certificate of Analysis for details.
*Small pack size (-SP) is supplied either lyophilized or as a 0.2 µm filtered solution in PBS.
*Small pack size (-SP) is supplied either lyophilized or as a 0.2 µm filtered solution in PBS.
Shipping
Lyophilized product is shipped at ambient temperature. Liquid small pack size (-SP) is shipped with polar packs. Upon receipt, store immediately at the temperature recommended below.
Stability & Storage
Use a manual defrost freezer and avoid repeated freeze-thaw cycles.
- 12 months from date of receipt, -20 to -70 °C as supplied.
- 1 month, 2 to 8 °C under sterile conditions after reconstitution.
- 6 months, -20 to -70 °C under sterile conditions after reconstitution.
Background: M-CSF R/CD115
M-CSF receptor, the product of the c-fms proto-oncogene, is a member of the type III subfamily of receptor tyrosine kinases that also includes receptors for SCF and PDGF. These receptors each contain five immunoglobulin-like domains in their extracellular domain (ECD) and a split kinase domain in their intracellular region (1-4). M-CSF receptor is expressed primarily on cells of the monocyte/macrophage lineage, dendritic cells, stem cells and in the developing placenta (1). Human M-CSF receptor cDNA encodes a 972 amino acid (aa) type I membrane protein with a 19 aa signal peptide, a 493 aa extracellular region containing the ligand-binding domain, a 25 aa transmembrane domain, and a 435 aa cytoplasmic domain. The human M-CSF R ECD shares 60%, 64%, 72%, 75%, 75%, and 76% aa identity with mouse, rat, bovine, canine, feline, and equine M-CSF R, respectively. Activators of protein kinase C induce TACE/ADAM17 cleavage of the M-CSF receptor, releasing the functional ligand-binding extracellular domain (5). M-CSF binding induces receptor homodimerization, resulting in transphosphorylation of specific cytoplasmic tyrosine residues and signal transduction (6). The intracellular domain of activated M-CSF R binds more than 150 proteins that affect cell proliferation, survival, differentiation and cytoskeletal reorganization. Among these, PI3Kinase, P42/44 ERK and c-Cbl are key transducers of M-CSF R signals (3, 4). M-CSF R engagement is continuously required for macrophage survival and regulates lineage decisions and maturation of monocytes, macrophages, osteoclasts and DC (3, 4). M-CSF R and integrin alphav beta3 share signaling pathways during osteoclastogenesis and deletion of either causes osteopetrosis (7, 8). In the brain, microglia expressing increased
M‑CSF R are concentrated with Alzheimers a beta peptide, but their role in pathogenesis is unclear (9, 10).
References
- deParseval, N. et al. (1993) Nucleic Acids Res. 21:750.
- Rothwell, V.M. and L.R. Rohrschneider (1987) Oncogene Res. 1:311.
- Chitu, V. and E.R. Stanley (2006) Curr. Opin. Immunol. 18:39.
- Ross, F.P. and S.L. Teitelbaum (2005) Immunol. Rev. 208:88.
- Rovida, E. et al. (2001) J. Immunol. 166:1583.
- Yeung, Y. et al. (1998) J. Biol. Chem. 273:17128.
- Dai, X. et al. (2002) Blood 99:111.
- Faccio, R. et al. (2003) J. Clin. Invest. 111:749.
- Li, M. et al. (2004) J. Neurochem. 91:623.
- Mitrasinovic, O.M. et al. (2005) J. Neurosci. 25:4442.
Long Name
Macrophage Colony Stimulating Factor Receptor
Alternate Names
c-fms, CD115, CSF1R, M-CSFR, MCSFR
Gene Symbol
CSF1R
UniProt
Additional M-CSF R/CD115 Products
Product Documents for Human M-CSF R/CD115 Antibody
Product Specific Notices for Human M-CSF R/CD115 Antibody
For research use only
Loading...
Loading...
Loading...
Loading...
Loading...
Loading...